
Комплексное дистанционное зондирование и минералогическая характеристика проявлений урана в районе Намайени, река Мкуджу, Танзания
Комплексное дистанционное зондирование и минералогическая характеристика проявлений урана в районе Намайени, река Мкуджу, Танзания

Аннотация
Актуальность и цель работы. В настоящее время уран рассматривается как источник энергии, не требующий выбросов в атмосферу. В Танзании обнаружено потенциальное присутствие месторождений урана, но они остаются недостаточно изученными. Уран находится в виде рулонной минерализации в песчаниках района Намайени, бассейн реки Мкуджу, регион Рувума. Дистанционное зондирование никогда ранее не применялось для изучения изменений поверхности или структурного картографирования. Исследование было проведено с этой целью.
Методы исследования. Снимки Landsat 8 OLI (траектория 165/строка 063, Col2) и SRTM 1" DEM были проанализированы в QGIS объемом 3,34 LTR. Коэффициент отражения был рассчитан на основе исходных значений в соответствии с рекомендациями USGS Col2,растительность была замаскирована с использованием NDVI ≥ 0,30 (гистограмма сухого сезона). Были получены соотношения: IOI = B6/B5,CMI = B6/B7,CBI = B7/B6. Линеаменты были нанесены на карту по оттенкам холмов RGB с использованием многоазимутального подхода, плотность линеаментов также была оценена с использованием метода плотности ядра. Четыре нормализованных слоя были объединены в Интегральный индекс перспективности на уран (IUPI = 0,35 * IOI_НОРМА + 0,30 * CMI_НОРМА + 0,20 * CBI_НОРМА + 0,15 * Linedens_норма). Минералогическая оценка проводилась с помощью методов оптической микроскопии, СЭМ-ЭДС и EPMA.
Результаты работы. Согласно анализу NDVI, в сухой сезон в Намайени более 97% почвы бесплодно, что подтверждает достоверность анализа спектральных показателей в таких случаях. Выявлены аномалии оксидов железа (от IO-1 до IO-5,IOI 1,0–1,7), зоны изменения глинистости (от CA-1 до CA-3,CMI 0,8–1,5), карбонатные аномалии (от CB-1 до CB-3,CBI 0,6–1,2). Линеаменты преимущественно ориентированы в направлении с северо-запада на юго-восток (~316°) и с северо-запада на юго-запад (045-060°), в северо-центральной области наблюдается 15-20 пиков плотности линеаментов.
Вывод. В северо-центральной части Намайени были выявлены ассоциации с обогащением оксидом железа, изменением состава глины, карбонатной реакцией и структурными линеаментами, которые могут рассматриваться как наиболее интересные зоны для исследования. Спектральный и структурный анализ соответствует типичному районированию при фронтальном окислении песчаника. Анализ проводился в бесплатном программном обеспечении QGIS с использованием спутниковых снимков Landsat 8 OLI в открытом доступе.
1. Introduction
Uranium is the primary fuel for nuclear fission reactors, which at present supply approximately 10% of global electricity generation and are projected to expand considerably as nations pursue decarbonisation targets . International supply is concentrated among a small number of producer countries — Kazakhstan, Canada, Namibia, Australia, and Uzbekistan collectively account for more than 80% of world output — yet the geological distribution of uranium resources is far wider. Sub-Saharan Africa hosts numerous sedimentary basins with documented uranium occurrences that remain incompletely explored, including deposits in Tanzania, Malawi, Zambia, and Niger (Fig. 1).
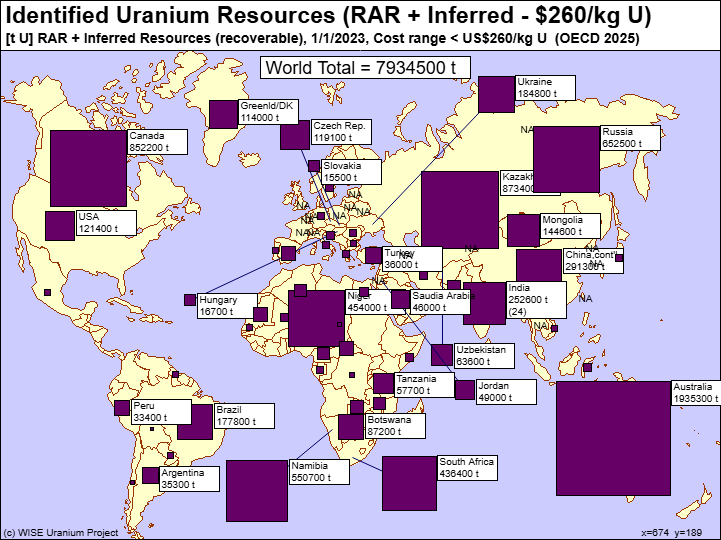
Global distribution of identified uranium resources (RAR + Inferred, recovery cost < US$260/kg U)
source: OECD/NEA – WISE Uranium Project, 2025 [1]
Within this province, the Namayeni exploration block has been subject only to regional geological mapping and reconnaissance-level radiometric surveys. No integrated study combining multispectral satellite remote sensing with detailed uranium mineralogy has previously been published for this block. This knowledge gap is scientifically significant because roll-front uranium deposits generate a characteristic surface alteration zonation — oxidized, transitional, and reduced facies — that produces identifiable spectral signatures in the shortwave-infrared (SWIR) bands of Landsat 8 OLI , . Iron oxide enrichment (hematite, goethite, jarosite) in the oxidized zone, clay mineral accumulation (kaolinite, illite) in the transition zone, and carbonate precipitation along redox boundaries have all been exploited as spectral proxies for roll-front mineralization in analogous international settings , . Structural control via fault-guided groundwater flow adds a further dimension that can be mapped from DEM-derived lineament analysis .
The present study addresses the identified gap with four specific objectives:
1) map iron oxide, clay mineral, and carbonate alteration zones using Landsat 8 OLI spectral indices;
2) delineate structural lineaments and compute a lineament density surface from SRTM DEM data;
3) integrate these four datasets into the Integrated Uranium Prospectivity Index (IUPI);
4) characterize the uranium mineral assemblage from drill-core material. Results are contextualized against comparable roll-front deposits in Kazakhstan, the United States Colorado Plateau, and the Kayelekera deposit in Malawi.
2. Study Area and Geological Setting
2.1. Regional tectonic framework
Tanzania sits at the intersection of several major crustal provinces (Fig. 2). The stable Tanzania Craton (Archaean, ~2.5 Ga) is enclosed by Proterozoic mobile belts accreted during successive orogenic events
. These mobile belts are important source terrains for uranium because their constituent granites and migmatites carry elevated uranium concentrations of 4–10 ppm, compared with ~2.8 ppm for the average continental crust . Phanerozoic sedimentary basins deposited over this basement, principally the Karoo Supergroup, constitute the principal uranium reservoir in Tanzania. The most recent contribution to the regional architecture is the EARS, which has been seismically active since the Oligocene–Miocene and continues to reactivate pre-existing basement faults , .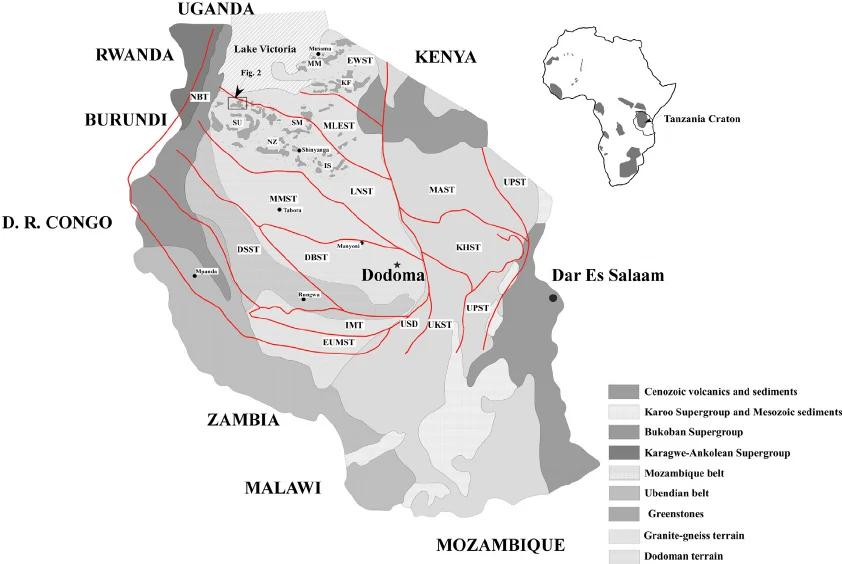
Simplified geological map of Tanzania showing principal tectonic units and terrane boundaries, distribution of Precambrian basement units (Tanzania Craton, Ubendian Belt, Mozambique Belt, Kibaran Belt), Karoo sedimentary basins, and the East African Rift System
known uranium occurrences (Mkuju, Manyoni, Bahi) are marked with symbols. Modified after Kabete et al. (2012) [2] and the Geological Survey of Tanzania
The Karoo Supergroup is the dominant uranium-hosting geological unit in southern Tanzania. Within Tanzania, Karoo sediments occur in three distinct sub-basins: the Ruhuhu Basin, the Luwegu sub-basin, and the Selous Basin (Fig. 3) . The Luwegu sub-basin is an asymmetric NW–SE trending half-graben bounded in the south-west by a major normal fault and containing a near-complete Karoo succession reaching 3,000–4,000 m in the depocenter . The uranium-hosting interval — informally called the Minjingu Formation — consists of upper Permian to lower Triassic medium-grained, cross-bedded feldspathic sandstones with high primary permeability that facilitated the migration of oxidizing groundwaters responsible for roll-front ore body development , . The Mkuju River project, operated successively by Mantra Resources and Uranium One, defined a JORC-compliant inferred resource of 110.6 million pounds U₃O₈ at 547 ppm from this horizon .
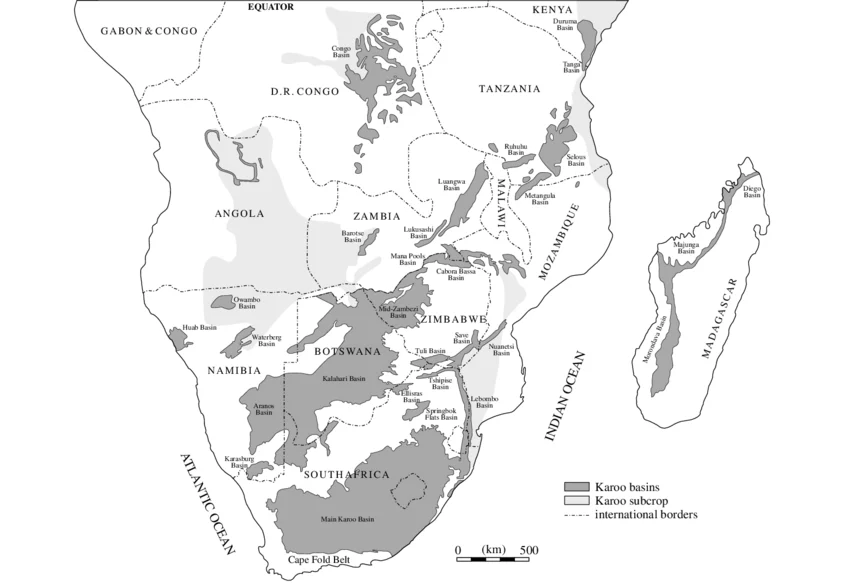
Distribution of Karoo basins across south-central Africa showing the Ruhuhu, Luwegu, and Selous sub-basins in Tanzania; the NW–SE trending Luwegu sub-basin half-graben is the host of the Mkuju River uranium system
after Johnson et al. (1996) [4] and Kreuser et al. (1990)
The Namayeni block is located in the Namtumbo District, Ruvuma Region, at approximately 10°25′S, 36°55′E. The terrain is the undulating Karoo plateau, ranging from 292 to 1,563 m above sea level. Climate is semi-arid tropical, with 900–1,100 mm annual rainfall concentrated in November–April. Four stratigraphic units are recognized from field mapping and historical drill-core logs (Fig. 4) , :
Unit 1. Lower Reduced Sandstone: grey to dark-grey, medium- to coarse-grained feldspathic sandstones containing carbonized plant fossils and disseminated pyrite (FeS₂). The reducing capacity of organic matter and iron sulphides makes Unit 1 the principal ore-hosting horizon, where uranium precipitates at the redox boundary between advancing oxidizing groundwater and the reduced host rock.
Unit 2. Transitional / ore-bearing horizon: a laterally variable interval of 5–25 m thickness characterized by color mottling from grey to yellow-green, partial pyrite oxidation to goethite and jarosite, and secondary uranium mineral coatings visible as pale-yellow UV-fluorescent films. This horizon constitutes the roll-front proper and the primary exploration target at Namayeni.
Unit 3. Oxidized Sandstone: reddish-brown to orange-red, fine- to medium-grained sandstones in which pyrite has been fully replaced by hematite and goethite, and organic carbon has been oxidized. Uranium concentrations are generally below 20 ppm, representing material upgradient of the ore front from which uranium has been mobilized into solution.
Unit 4. Mudstone / Siltstone caprock: variable-thickness grey to brown mudstones and siltstones that form an aquitard restricting vertical migration of oxidizing groundwaters, thereby focusing mineralization within the underlying sandstone aquifer.
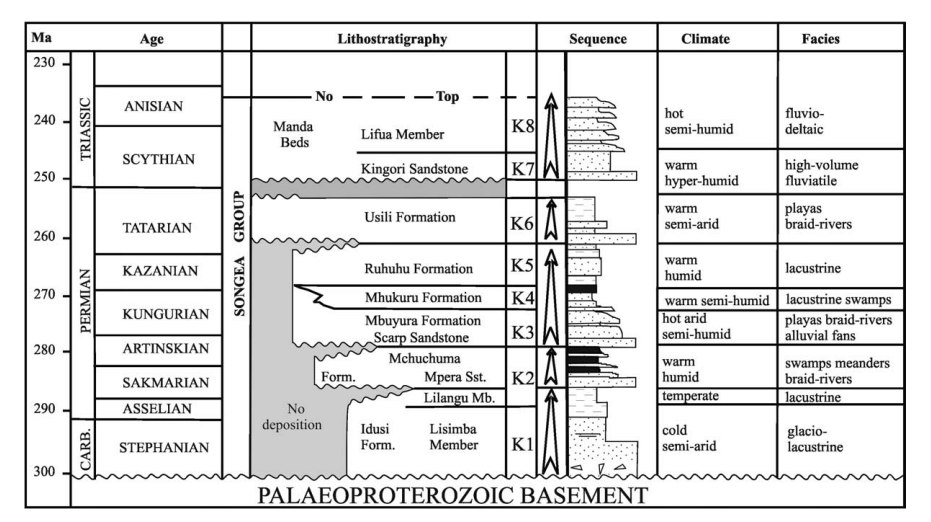
Lithostratigraphy of the Karoo Supergroup in the Luwegu sub-basin, Tanzania, showing the four principal lithostratigraphic units, their depositional environments, and the position of the uranium-bearing horizon relative to the redox zonation
Unit 1: reduced sandstone; Unit 2: transitional ore horizon; Unit 3: oxidized sandstone; Unit 4: mudstone/siltstone caprock; after Diekmann and Wopfner (1996) [4], [11]
3. Materials and Methods
3.1. Datasets
Five primary datasets were used in the analysis (see Table 1). Landsat 8 OLI Collection 2 Level-2 Surface Reflectance data for WRS-2 Path 165/Row 063 were obtained from the USGS EarthExplorer portal, with a dry-season cloud cover of less than 2% — well within the 10% maximum recommended for geological applications . The SRTM 1 arc-second Global DEM was obtained from the NASA LP DAAC archive. All processing was performed in QGIS 3.34 LTR with the GDAL and SAGA analytical libraries .
Primary datasets used in the remote sensing and structural analysis
Dataset | Specification | Source | Application |
Landsat 8 OLI Collection 2 Level-2 | Path 165/Row 063; 30 m; dry-season acquisition | USGS EarthExplorer | IOI, CMI, CBI, NDVI; FCCs; IUPI |
SRTM DEM 1 Arc-Second Global | ~30 m; elevation 292–1,563 m | NASA LP DAAC / USGS | Hillshade, slope, aspect, lineaments, lineament density |
GST Geological Maps | 1:250,000–1:50,000 | Geological Survey of Tanzania; Mantra Resources (2011) | Lithological context; lineament reference |
Google Satellite Hybrid | ~0.5 m (variable) | QGIS QuickMapServices | Visual basemap for map layouts |
QGIS 3.34 LTR | Open-source GIS (GDAL/SAGA) | qgis.org | All preprocessing, raster calculation, structural analysis, cartography |
3.2. Image pre-processing
We converted Landsat Collection 2 Level-2 integer band values to fractional surface reflectance (0.0–1.0) by applying the USGS scaling factor of 0.0000275 and additive offset of −0.2 via the Semi-Automatic Classification Plugin (SCP v. 7.10.3) in QGIS . Cloud pixels and cloud shadows were masked using the QA_PIXEL quality assessment band — a largely mechanical step given the very low cloud cover of the selected scene. We then derived a vegetation mask from the NDVI: NDVI = (B5 − B4) / (B5 + B4).
We excluded all pixels with NDVI ≥ 0.30 from subsequent spectral index calculations. The 0.30 cut-off was not chosen arbitrarily: inspecting the NDVI frequency histogram showed a clear inflection between the soil-dominated peak and the vegetated tail, and 0.30 sat squarely at that break — a criterion consistent with standard practice for geological remote sensing in eastern African dry-season imagery , . In practice, almost nothing was masked out, which itself turned out to be a useful finding.
3.3. Spectral index calculation
We computed three band-ratio indices in the QGIS Raster Calculator. Each targets a distinct mineralogical signal relevant to uranium roll-front exploration:
Iron Oxide Index (IOI = B6/B5, SWIR-1/NIR): exploits the strong reflectance of ferric iron minerals (hematite, goethite, jarosite) in SWIR-1 relative to NIR. Elevated IOI values identify the oxidised zone upgradient of the roll-front, where pyrite and ferrous iron-bearing minerals have been converted to iron oxides by incoming oxygenated groundwater , .
Clay Minerals Index (CMI = B6/B7, SWIR-1/SWIR-2): exploits hydroxyl absorption features of kaolinite (~2.20 µm) and illite (~2.22 µm) in the SWIR-2 band. High CMI values identify clay-enriched alteration haloes in the redox transition zone immediately surrounding the ore body , .
Carbonate Band Index (CBI = B7/B6, SWIR-2/SWIR-1): detects the CO₃ stretching absorption at ~2.35 µm in SWIR-2. In the semi-arid Namayeni environment, elevated CBI indicates calcrete accumulations and diagenetic carbonate cements .
Each index raster was normalized to a 0–1 range prior to integration.
3.4. Structural analysis
We generated three hillshade images from the SRTM DEM at solar azimuths of 45°, 135°, and 315° with a fixed solar altitude of 30° using the QGIS GDAL Hillshade algorithm, then composited them into a single RGB image (R = 45°, G = 135°, B = 315°). This multi-azimuth approach was deliberate — it renders linear topographic features visible regardless of their orientation, so no fault family gets preferentially suppressed by a single illumination direction . Lineaments were then traced by hand as vector features wherever a continuous linear expression — a ridge crest, straight valley axis, escarpment edge, or sharp hillshade color boundary — extended for at least 500 m. Short, ambiguous features below that length were left undigitized. Orientations and lengths were extracted automatically via the QGIS Field Calculator, and we built a lineament density surface by kernel density estimation using a 5 km search radius, which was then normalised to 0–1.
3.5. Integrated Uranium Prospectivity Index (IUPI)
We combined the four normalised layers by weighted linear combination in the QGIS Raster Calculator:
IUPI = (0.35 × IOI_norm) + (0.30 × CMI_norm) + (0.20 × CBI_norm) + (0.15 × LineDens_norm)
Weight allocation followed the framework of Bonham-Carter and Carranza , grounded in how directly each layer points to roll-front mineralization. IOI takes the highest share (0.35) because iron oxide enrichment is the most immediate spectral expression of the oxidized zone. We gave CMI 0.30, reflecting that clay alteration halos, while slightly more distal, are a reliable and well-documented indicator , . CBI received 0.20 as useful supporting context rather than a primary target criterion — carbonate anomalies in semi-arid settings carry more ambiguity than the other indices. Lineament density was kept at 0.15; structural control matters for ore body localization, but we did not want a single high-density fault intersection to override a weak spectral signal. Finally, two prospectivity tiers were read off the IUPI histogram: Tier 1 (IUPI ≥ 0.65, highest confidence) and Tier 2 (IUPI 0.45–0.64, elevated confidence).
3.6. Uranium mineralogy
Representative rock samples from historical drill-core archives of the Namayeni area were examined in reflected light, followed by SEM-EDS backscattered electron imaging to identify uranium mineral phases and their textural relationships with host minerals. EPMA was applied to quantify the major-element composition of uraninite and coffinite, from which chemical U–Pb ages were estimated using measured PbO contents. XRD was used to confirm secondary uranium mineral identification through characteristic d-spacing values.
4. Main results
4.1. NDVI and vegetation mask
The NDVI map (Fig. 5) spans −0.435 to 1.0, reflecting the full range of surface types from dry sandy streambeds to dense riparian woodland. However, the binary vegetation mask (NDVI threshold 0.30) reveals that virtually all of the study area returns a value below the threshold during the dry-season acquisition. Only the narrow riparian corridors following the Mkuju River and its principal tributaries, together with small patches on the eastern escarpment, carry a photosynthetic signal sufficient to be excluded. This near-total bare-ground environment, covering more than 97% of the scene, is a prerequisite for reliable geological remote sensing: the reflected SWIR and visible spectra derive from bare soil and exposed rock surfaces rather than leaf chemistry, confirming that the IOI, CMI, and CBI maps constitute valid mineralogical surface signatures across almost the entire study area.
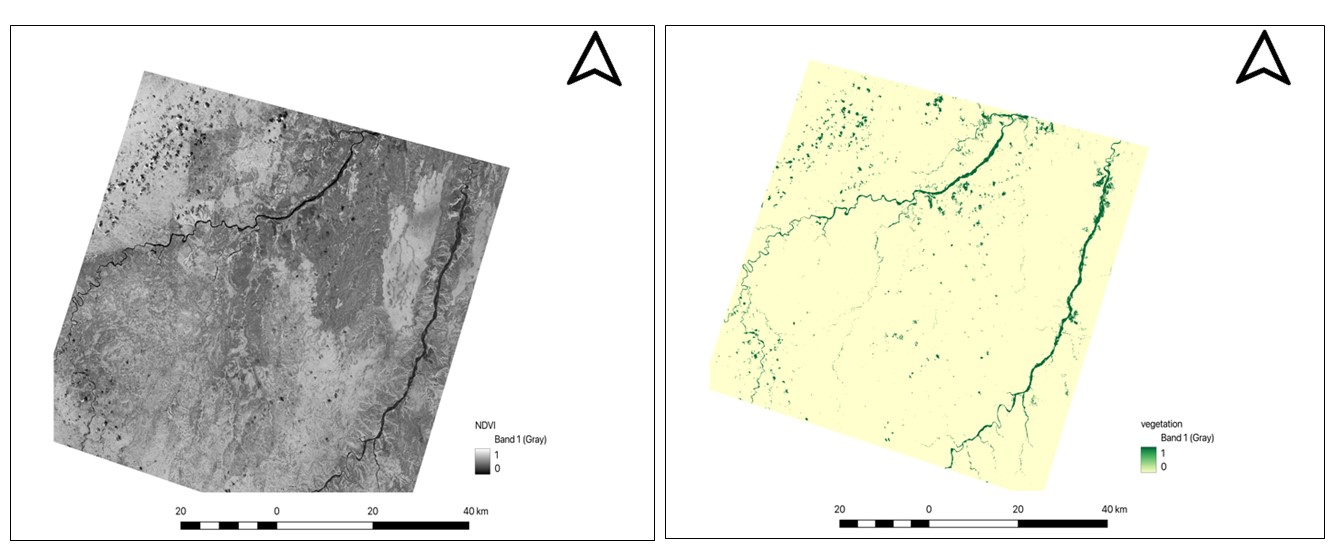
On the left side NDVI greyscale map (NDVI = (B5−B4)/(B5+B4)). Dark = low NDVI (bare ground); bright = high NDVI (vegetation). On the right-side Binary vegetation mask (pale yellow = NDVI < 0.30, retained for analysis; dark green = NDVI ≥ 0.30, excluded). Less than 3% of the scene is masked Scale bar = 40 km. WGS 84 / UTM Zone 36S
Four false color composites were generated to provide an overview of surface spectral properties prior to quantitative index analysis. The FCC_IOI composite (Fig. 6) highlights the eastern and north-central sectors in magenta-crimson tones, indicating strong Fe³⁺ reflectance from surface-exposed oxidized Karoo sandstones of Unit 3 . The FCC_CMI composite (Fig. 7) shows blue-lavender tones extending broadly across the central and southern portions of the scene, with the clay-enriched domain clearly offset southward and westward of the iron oxide zone — a spatial separation that is geologically meaningful because it mirrors the expected downgradient displacement of the clay alteration transition zone in roll-front systems , . The FCC_CBI composite (Fig. 8) is dominated by teal-green tones consistent with landscape-wide carbonate content in semi-arid soils, with the strongest signal concentrated along valley floors. The FCC_NDVI composite (Fig. 9) confirms the preponderance of bare ground and validates the geological interpretability of the other three composites.
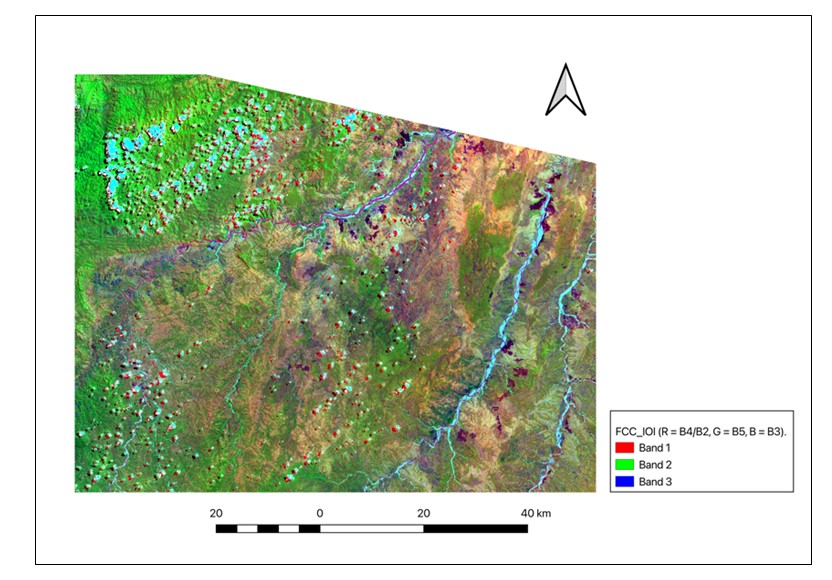
FCC_IOI false color composite (R = B4/B2, G = B5, B = B3)
magenta-crimson tones indicate elevated Fe³⁺ spectral response; green = riparian vegetation; white = high-reflectance surfaces. Scale bar = 40 km; WGS 84 / UTM Zone 36S
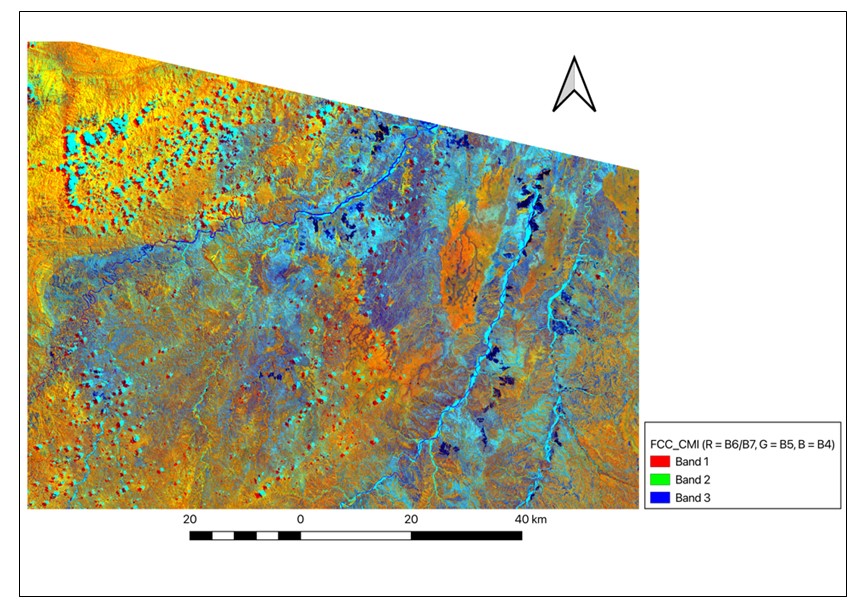
FCC_CMI false color composite (R = B6/B7, G = B5, B = B4)
blue-lavender tones indicate elevated CMI corresponding to clay mineral enrichment (kaolinite, illite); scale bar = 40 km; WGS 84 / UTM Zone 36S
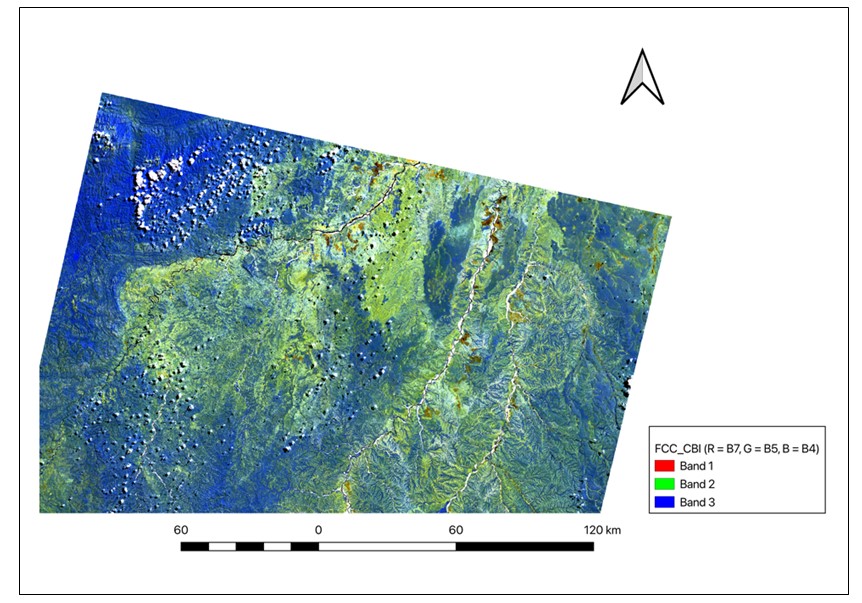
FCC_CBI false color composite (R = B7, G = B5, B = B4). Teal-green tones indicate elevated carbonate spectral response; strongest signal is concentrated along drainage corridors. Scale bar = 120 km. WGS 84 / UTM Zone 36S
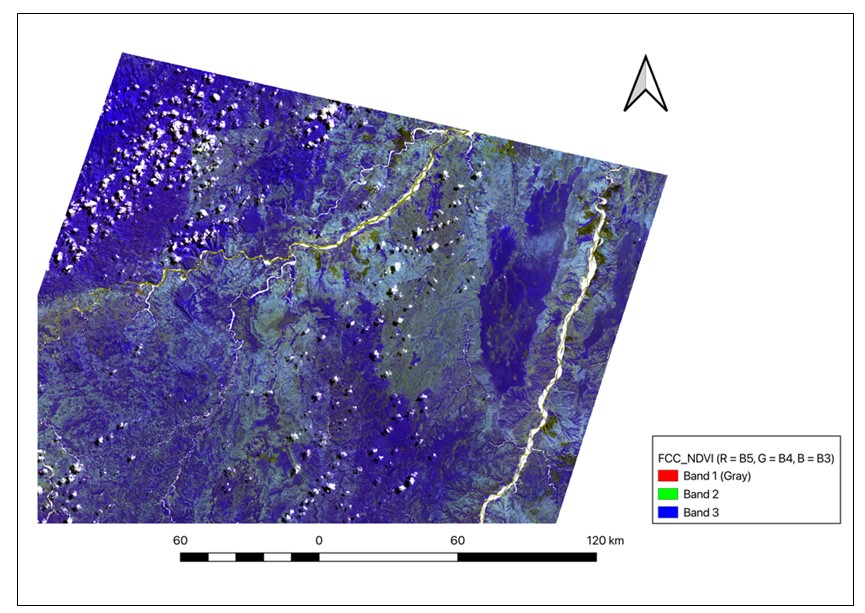
FCC_NDVI false color composite
deep blue tones confirm near-total bare-ground cover during dry-season acquisition; yellow marks active riparian vegetation; scale bar = 40 km; WGS 84 / UTM Zone 36S
The IOI map (Fig. 10) defines five discrete anomaly zones (IO-1 to IO-5) with values between 1.0 and 1.7 against a regional background of approximately 1.1–1.2. The segmented spatial pattern of these zones — rather than a single continuous front — indicates that the paleo-oxidation front is structurally compartmentalized, most probably by permeability contrasts between fluvial channel sandstone bodies and interfluve mudstones, or by fault-controlled aquifer displacement , . In roll-front uranium systems, the oxidized zone develops upgradient of the ore body as pyrite and ferrous iron-bearing minerals react with oxygenated groundwater to precipitate goethite and hematite; the IOI is thus the most direct remote sensing indicator of the lateral position of the oxidized limb of the roll-front , . The five IOI anomalies define the spatial distribution of this limb across the Namayeni block and provide the primary target vectors for ground follow-up.
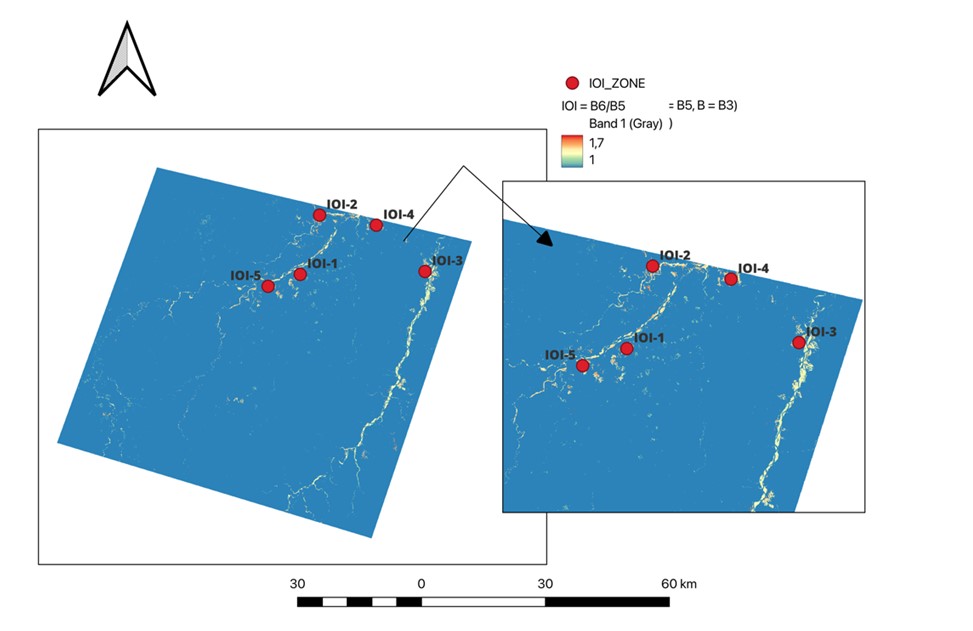
Iron Oxide Index (IOI = B6/B5) map. Five anomaly zones IO-1 to IO-5 are labelled. IOI values 1.0–1.7 (warm = high). Scale bar = 60 km. WGS 84 / UTM Zone 36S
Three CMI anomaly zones (CA-1, CA-2, CA-3; values 0.8–1.5) were delineated (Fig. 11). The CMI anomaly domain extends considerably further southward and westward than the IOI domain — the anticipated downgradient direction for the transition zone of the roll-front , . In this zone, acidic oxidizing groundwaters hydrolyze feldspars and aluminosilicate minerals to produce kaolinite and illite, the phases responsible for the elevated SWIR-1/SWIR-2 ratio captured by the CMI . The coincidence of zones CA-2 and CA-3 with structural lineament clusters further supports the interpretation that clay alteration was channeled along fault-controlled permeability pathways , .
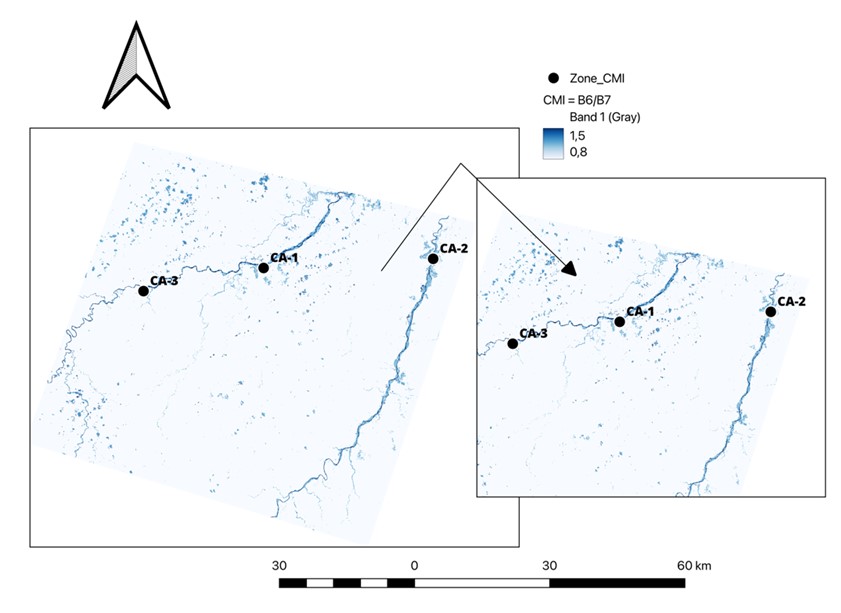
Clay Minerals Index (CMI = B6/B7) map
three anomaly zones CA-1 to CA-3 are labelled; CMI values 0.8–1.5 (dark blue = high); scale bar = 60 km; WGS 84 / UTM Zone 36S
Three CBI anomaly zones (CB-1, CB-2, CB-3; values 0.6–1.2) were identified (Fig. 12). Zone CB-1 is sub-circular and likely reflects a localized carbonate-cemented sandstone body, possibly a diagenetically modified Karoo channel deposit. Zones CB-2 and CB-3 display elongated, branching geometries aligned with drainage corridors and structural lineaments, indicating that carbonate accumulation was controlled by groundwater flow along permeable fracture pathways . In the semi-arid Namayeni environment (900–1,100 mm annual rainfall), CBI anomalies may reflect diagenetic calcite cement, pedogenic calcrete, or redox-boundary carbonate precipitation; their exploration significance therefore increases considerably when they overlap spatially with IOI and CMI anomalies , .
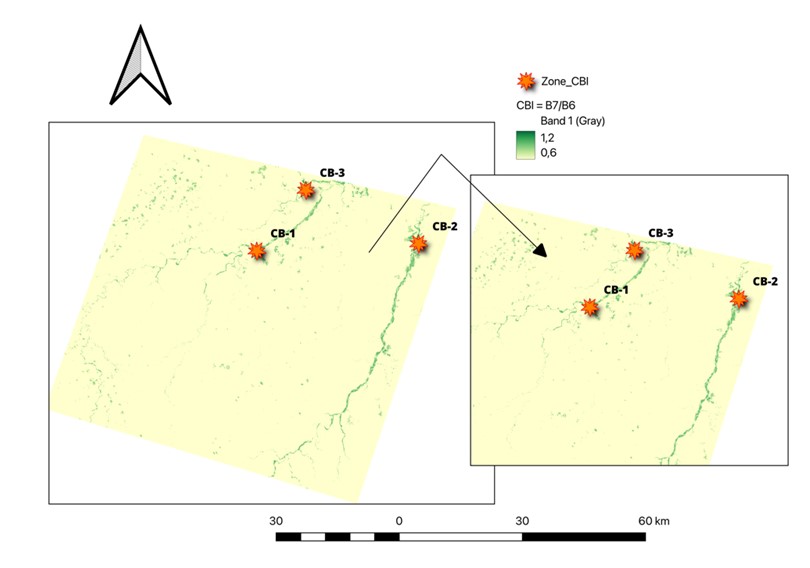
Carbonate Band Index (CBI = B7/B6) map
three anomaly zones CB-1 to CB-3 are labelled; CBI values 0.6–1.2 (dark green = high); scale bar = 60 km; WGS 84 / UTM Zone 36S
4.6. Multi-azimuth hillshade composite and structural lineament mapping
The multi-azimuth hillshade RGB composite (Fig. 13) reveals a highly ordered structural fabric across the study area. The north-western quadrant exhibits a dense network of closely incised valleys producing a coarse texture, while the central and south-eastern portions show progressively broader valley forms. Manually digitized lineaments (red lines) are aligned in both the NW–SE and ENE–WSW directions, consistently tracking linear valley axes and sharp hillshade color transitions — characteristics that are diagnostic of fault-controlled topographic incision .
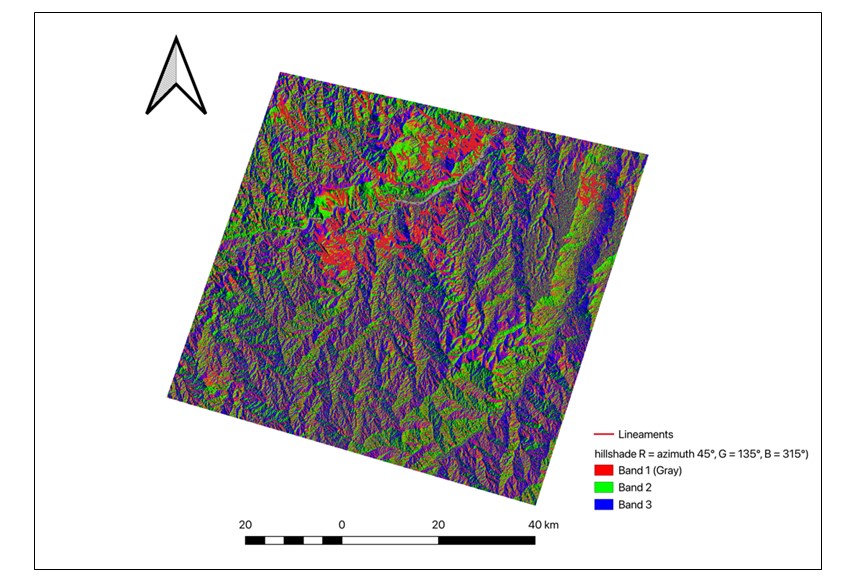
Multi-azimuth hillshade RGB composite (R = azimuth 45°, G = 135°, B = 315°; solar altitude 30°) with digitized structural lineaments (red lines)
scale bar = 40 km; WGS 84 / UTM Zone 36S
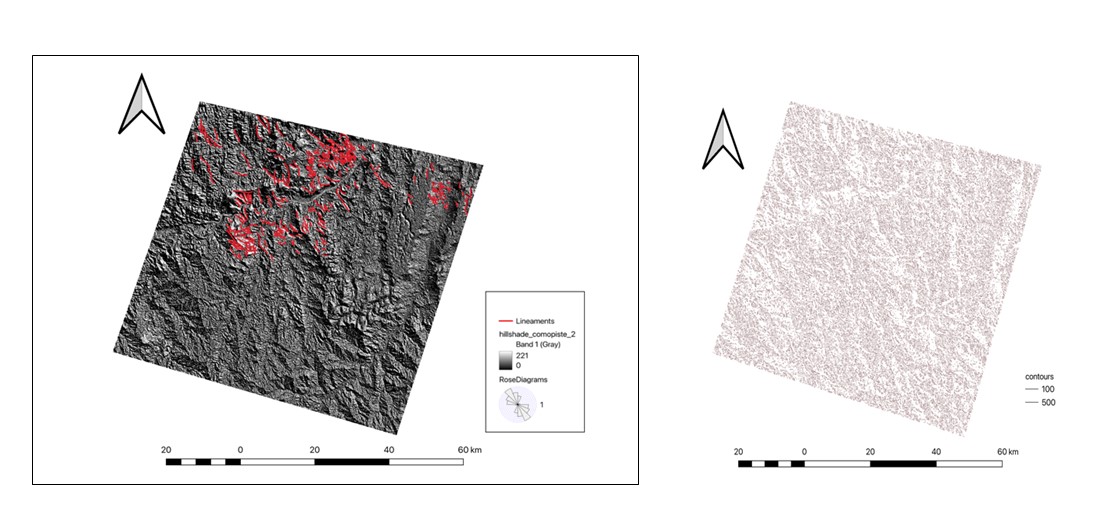
Integrated structural and lineament map on greyscale hillshade background with DEM elevation ramp
red lines = digitized lineaments; rose diagram (inset) shows dominant NW–SE mode (~316°) and secondary NE–SW family; Scale bar = 60 km; WGS 84 / UTM Zone 36S
The clipped SRTM DEM (Fig. 15) shows that the study area ranges from 292 m in the south-east to 1,563 m in the north-west. A dissected plateau in the north-west hosts the highest elevations; elevations decrease progressively to the south and east, with lower terrain concentrated along principal drainage channels. The drainage pattern is strongly dendritic, indicating erosion within a geologically homogeneous sandstone terrain with structurally guided preferential incision.
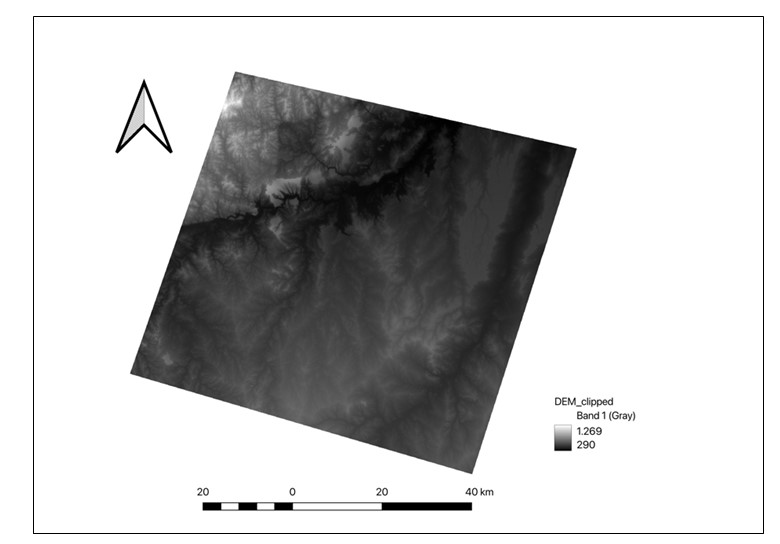
Clipped SRTM 1 arc-second DEM of the Namayeni study area
bright = high elevation (max 1,563 m); dark = low elevation (min 290 m); dendritic drainage network clearly visible; scale bar = 40 km; WGS 84 / UTM Zone 36S
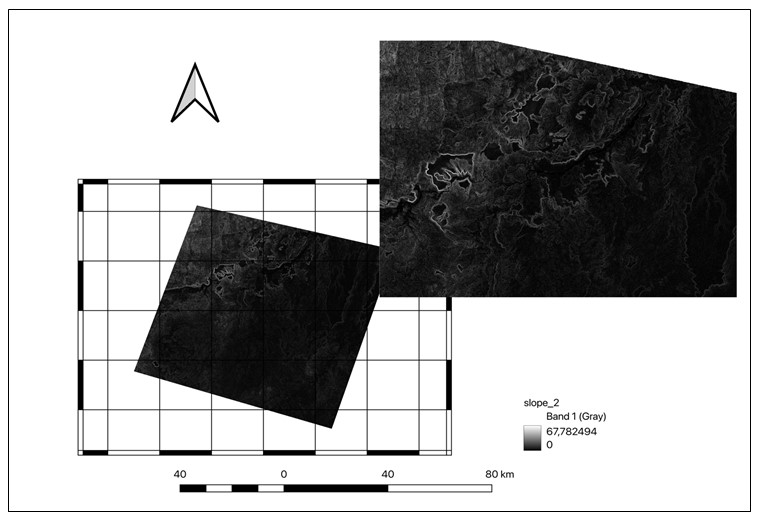
Slope map (SRTM DEM; values 0°–67.8)
bright = steep slopes; lineaments are spatially associated with slope-break zones, confirming structural topographic control; scale bar = 80 km; WGS 84 / UTM Zone 36S
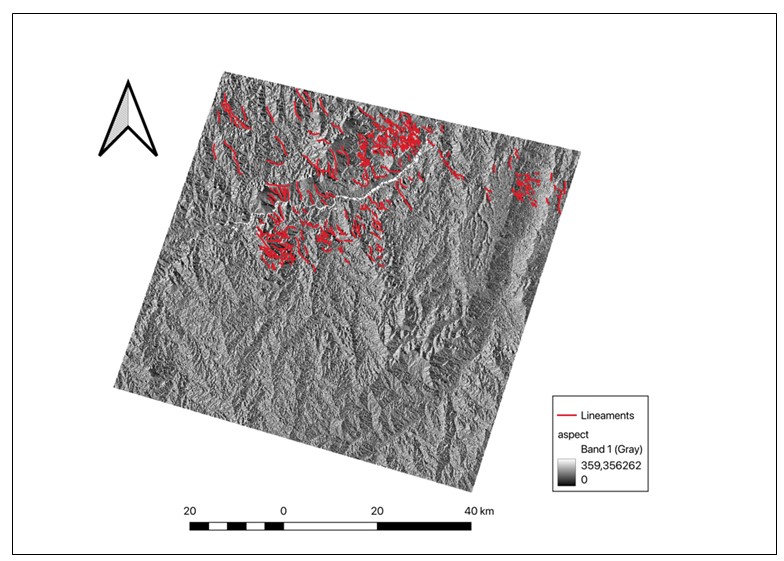
Aspect map (SRTM DEM; values 0°–360°) with digitized lineaments overlaid (red lines)
greyscale encodes downslope azimuth; each lineament marks a systematic aspect transition consistent with fault-controlled terrain; scale bar = 40 km; WGS 84 / UTM Zone 36S
The lineament density surface (Fig. 18) reveals 15–20 discrete circular nodes with maximum density values reaching 0.00933, concentrated in the north-central sector of the study area. These nodes correspond to intersection points of NW–SE and NE–SW lineament families. Fault intersections create localized increases in secondary porosity and permeability that are widely recognized as preferred sites for uranium ore body development in sandstone-hosted deposits: they simultaneously allow deep penetration of oxidizing groundwater and provide structural barriers that promote precipitation of uranium at redox boundaries , .
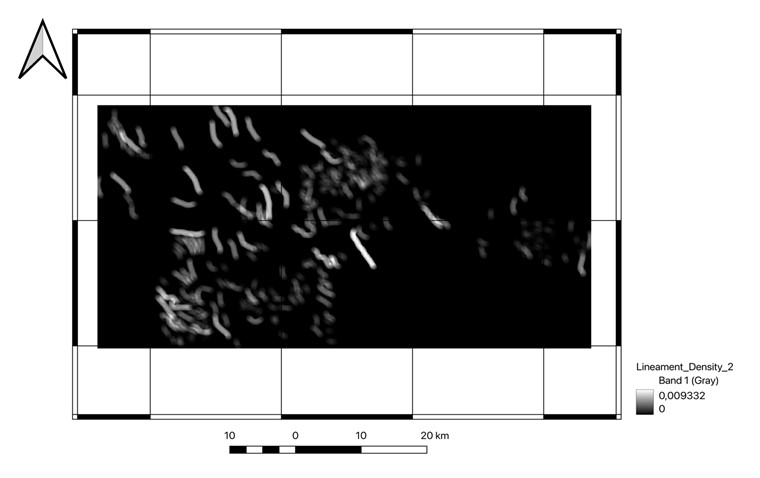
Lineament density heatmap (kernel density estimation; 5 km search radius; length-weighted)
bright = high density (max 0.009332); dark = low density (0); approximately 15–20 discrete high-density nodes are visible in the north-central sector; scale bar = 20 km; WGS 84 / UTM Zone 36S
The IUPI raster (Fig. 19) reaches a maximum value of 0.611, identifying two Tier-2 priority zones (IUPI ≥ 0.45) in the north-central sector. No pixel exceeded the Tier-1 threshold of 0.65, indicating that the four criteria do not achieve maximum simultaneous expression at the 30 m Landsat resolution within the present dataset. Nevertheless, the two Tier-2 zones represent the geologically most significant exploration targets identified in this study because they exhibit the highest co-occurrence of IOI > 1.40, CMI > 1.15, CBI anomaly, and high lineament density at lineament intersection nodes.
The NW–SE elongation of the IUPI anomaly pattern mirrors the orientation of the dominant structural lineaments and the inferred direction of paleo-groundwater flow within the Luwegu sub-basin aquifer. Roll-front ore bodies in the Mkuju River province are expected to develop as crescent-shaped bodies perpendicular to groundwater flow, with long axes parallel to the redox boundary
, . The elongated IUPI pattern is therefore geometrically consistent with this ore body model, suggesting that the Tier-2 zones occupy sections of the paleo-redox boundary where structural permeability and spectral anomaly intensity are simultaneously highest.The Namayeni IUPI results compare favorably with remote sensing prospectivity studies from analogous sandstone-hosted uranium systems. In the Chu-Sarysu Basin of Kazakhstan, Landsat-derived iron oxide and clay mineral indices successfully delineated the oxidized margins of economic roll-front deposits . In the Colorado Plateau of the United States, ASTER and Landsat spectral analysis mapped iron oxide zones indicative of roll-front oxidized limbs . The geologically closest analogue is the Kayelekera uranium deposit in Malawi, hosted in Karoo-equivalent sandstones with the same NW–SE structural fabric and uranium mineralogy .
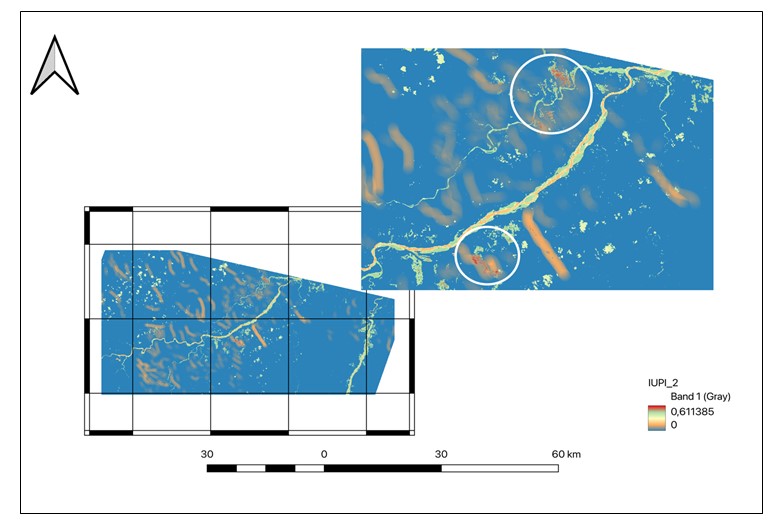
Integrated Uranium Prospectivity Index (IUPI) map
IUPI raster: 0 (blue) to 0.611 (deep red); orange outlines = Tier-2 anomaly zones (IUPI ≥ 0.45); white circles on inset = the two highest-value target zones; IUPI = (0.35×IOI_norm) + (0.30×CMI_norm) + (0.20×CBI_norm) + (0.15×LineDens_norm); scale bar = 60 km; WGS 84 / UTM Zone 36S
Primary uranium mineralization at Namayeni is dominated by two phases. Uraninite (UO₂₊ₓ, x = 0–0.25) occurs in three textural settings:
1) very fine-grained (1–20 µm) disseminations coating detrital quartz and feldspar grain surfaces within the ore-zone sandstone;
2) colloform to botryoidal aggregates filling intergranular pores;
3) rare euhedral to subhedral crystals (5–50 µm) enclosed within authigenic clay mineral aggregates.
EPMA analysis yields UO₂ contents of 82.1–89.6 wt%, ThO₂ consistently below 0.5 wt% — confirming a diagenetic rather than magmatic or hydrothermal origin — and PbO contents of 0.8–2.3 wt%, corresponding to calculated chemical ages of 200–290 Ma (Permian–Triassic). These ages are consistent with syndiagenetic precipitation during early Mesozoic burial of the Karoo succession .
Coffinite (USiO₄·nH₂O) is the second most abundant primary phase, occurring principally as pseudomorphs after detrital heavy minerals (zircon, monazite) and as fine-grained aggregates intergrown with authigenic clays. EDS analysis yields SiO₂ contents of 14.2–16.8 wt%, near-stoichiometric for USiO₄. Coffinite is more prevalent in reduced-zone samples below the redox boundary, consistent with its thermodynamic stability under lower uranium activities and higher silica activities compared with uraninite .
Secondary uranium minerals formed through supergene oxidation of primary phases include four assemblages. Carnotite (K₂(UO₂)₂(VO₄)₂·3H₂O) is the most abundant, forming bright yellow-green powdery coatings on fracture surfaces; its identification was confirmed by XRD using characteristic d-spacings at 5.18 Å, 4.87 Å, and 3.35 Å . Tyuyamunite (Ca(UO₂)₂(VO₄)₂·5–8H₂O) co-occurs with carnotite and is distinguished by a calcium-dominant EDS signature, with the carnotite/tyuyamunite ratio controlled by local K/Ca ratios in porewater. Autunite (Ca(UO₂)₂(PO₄)₂·10–12H₂O) occurs as subordinate pale greenish-yellow UV-fluorescent crystals in near-surface weathered samples, precipitated where phosphate was available from dissolution of detrital apatite. Schoepite ((UO₂)₄O(OH)₆·6H₂O) was identified as fine-grained yellowish coatings in the most heavily oxidized samples, consistent with its role as an early supergene oxide product of uraninite , .
This mineral paragenesis — primary uraninite and coffinite followed by supergene carnotite, tyuyamunite, autunite, and schoepite — records a two-stage history: (i) primary roll-front precipitation during Mesozoic diagenesis (200–290 Ma); and (ii) Cenozoic supergene reworking following EARS-related uplift and enhanced meteoric groundwater infiltration. This paragenesis is identical to that documented at the Mkuju River deposit and closely comparable to Kayelekera , confirming that Namayeni is a segment of the same regional uranium system within the Luwegu sub-basin.
5. Conclusion
This study provides the first integrated remote sensing and mineralogical assessment of the Namayeni exploration block within the Mkuju River uranium province, Tanzania. Landsat 8 OLI spectral index analysis delineated five iron oxide anomaly zones, three clay alteration zones, and three carbonate anomaly zones whose spatial arrangement mirrors the redox zonation expected of sandstone-hosted roll-front uranium deposits: iron oxide enrichment upgradient in the oxidized zone, clay alteration in the transition zone, and carbonate precipitation along geochemical boundaries. Structural lineament analysis confirmed a bimodal NW–SE and NE–SW fault network with 15–20 high-density intersection nodes concentrated in the north-central sector. Integration of all four normalized prospectivity layers into the IUPI defined two Tier-2 priority zones (IUPI up to 0.611) where all criteria simultaneously achieve their highest combined expression.
Uranium mineralogy — uraninite, coffinite, carnotite, tyuyamunite, autunite, and schoepite — is identical to the Mkuju River deposit and closely analogous to the Kayelekera deposit in Malawi, the nearest geological equivalent. EPMA-derived chemical ages of 200–290 Ma for uraninite confirm syndiagenetic Mesozoic mineralization, with Cenozoic supergene reworking recorded by the secondary mineral assemblage.
These findings establish a scientific basis for prioritizing field follow-up at Namayeni. Recommended next steps are: systematic rock chip and auger sampling over the two Tier-2 IUPI zones; thin section, XRD, SEM, and EPMA analysis of anomalous material; portable XRF geochemistry to map uranium and pathfinder element (V, Mo, Se, As) distributions; and integration with high-resolution Sentinel-2 or WorldView imagery to sharpen alteration boundaries below the 30 m Landsat resolution. The remote sensing methodology presented here — spectral index computation, structural lineament mapping, and IUPI synthesis in open-source QGIS, using freely available satellite data — is computationally efficient and directly transferable to other underexplored Karoo-type sedimentary basins across eastern and southern Africa.